

CME Group hits 20-day low amid market strength
CME Group Inc's stock fell by 3.64% during regular trading, hitting a 20-day low. This decline occurs despite the Nasdaq-100 rising by 0.58% and the S&P 500 gaining 0.39%, indicating a disconnect between CME's performance and broader market trends.
The drop in CME's stock price can be attributed to sector rotation, as the company faces caution from investors regarding its future performance. Recent reports indicate that CME Group achieved a record average daily volume of 28.1 million contracts in 2025, reflecting strong market demand. However, the stock's current price is close to its 52-week high, suggesting that while there is confidence in CME, the market is also wary of potential pullbacks.
Investors should closely monitor CME's long-term fundamentals and market trends, especially given the recent volatility. The company's diverse product offerings across various asset classes may provide a competitive edge, but the current price fluctuations warrant careful consideration in investment strategies.
Trade with 70% Backtested Accuracy
Analyst Views on CME

About CME
About the author


Market Volatility and Challenges During Trump's Presidency

- Historical Valuation Pressure: The S&P 500's Shiller P/E Ratio reached 42.84 in June, just 3.5% shy of the all-time high of 44.19 from 1999, indicating that such high valuations could lead to declines of over 20% in the future, posing significant risks for investors.
- Trumpflation Impact: The ongoing Iran conflict has pushed U.S. inflation to a three-year high of 4.2% in May, which may compel the Federal Reserve to raise interest rates before the end of 2026, increasing borrowing costs and potentially stifling the AI infrastructure build-out that has driven the market rally.
- Midterm Election Uncertainty: The upcoming midterm elections could disrupt the composition of Congress, with historical data showing an average peak-to-trough drawdown of 17.5% for the S&P 500 during midterm years, which could exacerbate market volatility and affect investor confidence.
- Investor Sentiment Shift: As the election season heats up, investor appetite for high-valued AI stocks and defense companies may wane, negatively impacting the stock market, particularly in sectors that have benefited from a unified government over the past year and a half.
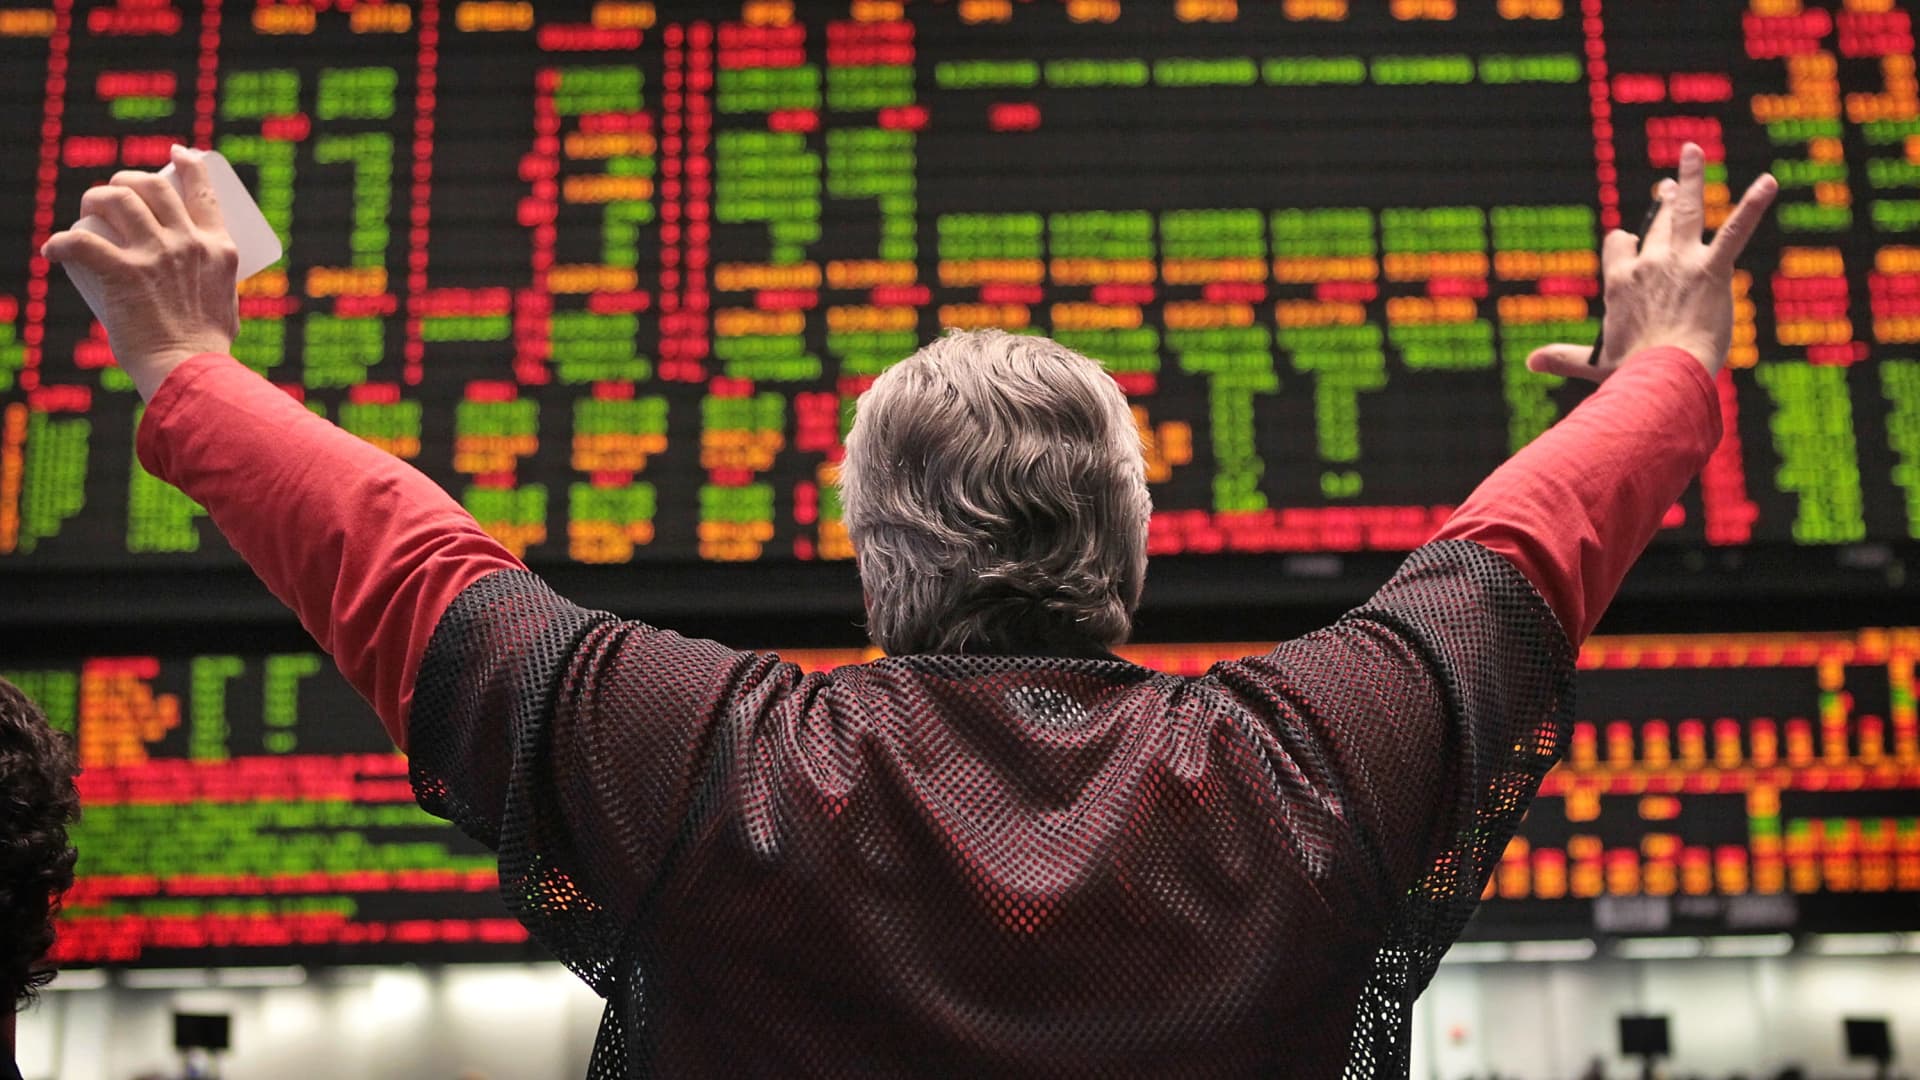
Analysis of Stock Market Performance During Trump's Presidency
- Market Return Trends: During Trump's presidency, the S&P 500 and Nasdaq Composite surged by 70% and 142% respectively, indicating strong market performance; however, short-term challenges may arise.
- Valuation Pressure: The S&P 500's Shiller P/E Ratio reached 42.84 in June, nearing the historical peak of 44.19, suggesting that current market valuations may be unsustainable and could lead to future corrections.
- Inflation Impact: The Trump-led Iran conflict has pushed U.S. inflation to a three-year high of 4.2% in May, which may prompt the Federal Reserve to raise interest rates, increasing borrowing costs and potentially dampening market activity.
- Midterm Election Risks: Midterm elections typically induce market volatility, with historical data showing an average drawdown of 17.5% for the S&P 500 during election years, necessitating cautious investor strategies in light of potential market uncertainties.
CME Group Reports Q2 Average Daily Volume of 29.8M Contracts
- Volume Performance: CME Group's average daily volume for Q2 reached 29.8 million contracts, a 1% year-over-year decline, yet remains the second highest in the history of the derivatives market, indicating sustained market activity.
- Interest Rate Contract Dynamics: The average daily volume for interest rate contracts was 14.5 million, down 6% year-over-year, reflecting a cautious market sentiment regarding interest rate fluctuations, which may impact future rate policy expectations.
- Equity Index Growth: Equity index contracts saw an average daily volume of 8.6 million, up 13% year-over-year, suggesting increased investor confidence in the stock market, potentially driving demand for related financial products.
- Energy and Agricultural Contract Volatility: Energy contracts averaged 2.7 million contracts daily, down 13% year-over-year, while agricultural contracts averaged 2.1 million, up 6%, highlighting varying market volatility and diverse investor strategies.

Gold Price Fluctuations and Investment Outlook
- Gold Price Review: Gold prices surged by 64% last year as investors flocked to safe-haven assets amid rising economic and political uncertainties; however, the price has since dropped by 27% from its all-time high, currently trading below $4,000 per ounce, indicating a shift in market sentiment.
- Inflation and Interest Rate Impact: The U.S. budget deficit reached $1.8 trillion in fiscal 2025, with another trillion-dollar deficit projected for fiscal 2026, pushing national debt towards $40 trillion, which has weakened demand for gold as investors react to the Federal Reserve's hawkish stance, reflecting uncertainty in future economic policies.
- Investment Strategy Adjustment: While gold is considered a good long-term investment, experts recommend that investors limit their gold allocation to 5% to 15% of total assets to ensure some protection during periods of high demand for safe-haven assets.
- ETF Investment Convenience: Many investors opt for exchange-traded funds (ETFs) like SPDR Gold Trust for gold investment, which offers convenience and low annual fees of just 0.4%, allowing investors to adjust their portfolios more flexibly amid gold market fluctuations.

U.S. Economy Adds 57,000 Jobs in June, Unemployment Rate at 4.2%
- Job Growth Slowdown: The U.S. added 57,000 nonfarm jobs in June, significantly lower than the revised 129,000 in May and below the 115,000 forecast, indicating a cooling economy that could dampen consumer confidence and spending.
- Unemployment Rate Shift: While the unemployment rate fell to 4.2%, the labor force participation rate dropped by 0.3 percentage points to 61.5%, the lowest since March 2021, reflecting underlying weaknesses in the labor market that may prompt policymakers to reassess economic outlooks.
- Stable Wage Growth: Average hourly earnings rose by 0.3% for the month and 3.5% year-over-year, aligning with consensus forecasts, suggesting that despite slower job growth, wage levels remain stable, which could support household consumption.
- Mixed Industry Performance: Professional and business services added 36,000 jobs, while leisure and hospitality lost 61,000, highlighting significant disparities across sectors that may affect the overall balance of economic recovery.
Gold Price Fluctuations and Investment Strategies
- Gold Price Volatility: Gold reached a record high of $5,418 per ounce in January 2023 but has since dropped by 27%, trading below $4,000, indicating shifts in market demand and investor sentiment.
- Inflation and Interest Rate Impact: The U.S. budget deficit for fiscal 2025 hit $1.8 trillion, with projections for another trillion-dollar deficit in 2026, pushing national debt towards $40 trillion; this has increased demand for gold as a safe haven, although expectations of Fed rate hikes have shifted market sentiment.
- Investment Return Comparison: Over the past 50 years, gold has averaged a return of 7.2% per year, while the S&P 500 has returned 11.9%, highlighting the advantages of stocks for long-term investment, even as gold retains its value during uncertain times.
- Portfolio Recommendations: Experts suggest allocating 5% to 15% of total assets to gold to ensure some exposure during high demand for safe-haven assets, while considering the storage and insurance costs of physical gold, making SPDR Gold Shares ETF a more convenient investment option.
Market Volatility and Challenges During Trump's Presidency
- Historical Valuation Pressure: The S&P 500's Shiller P/E Ratio reached 42.84 in June, just 3.5% shy of the all-time high of 44.19 from 1999, indicating that such high valuations could lead to declines of over 20% in the future, posing significant risks for investors.
- Trumpflation Impact: The ongoing Iran conflict has pushed U.S. inflation to a three-year high of 4.2% in May, which may compel the Federal Reserve to raise interest rates before the end of 2026, increasing borrowing costs and potentially stifling the AI infrastructure build-out that has driven the market rally.
- Midterm Election Uncertainty: The upcoming midterm elections could disrupt the composition of Congress, with historical data showing an average peak-to-trough drawdown of 17.5% for the S&P 500 during midterm years, which could exacerbate market volatility and affect investor confidence.
- Investor Sentiment Shift: As the election season heats up, investor appetite for high-valued AI stocks and defense companies may wane, negatively impacting the stock market, particularly in sectors that have benefited from a unified government over the past year and a half.
Analysis of Stock Market Performance During Trump's Presidency
- Market Return Trends: During Trump's presidency, the S&P 500 and Nasdaq Composite surged by 70% and 142% respectively, indicating strong market performance; however, short-term challenges may arise.
- Valuation Pressure: The S&P 500's Shiller P/E Ratio reached 42.84 in June, nearing the historical peak of 44.19, suggesting that current market valuations may be unsustainable and could lead to future corrections.
- Inflation Impact: The Trump-led Iran conflict has pushed U.S. inflation to a three-year high of 4.2% in May, which may prompt the Federal Reserve to raise interest rates, increasing borrowing costs and potentially dampening market activity.
- Midterm Election Risks: Midterm elections typically induce market volatility, with historical data showing an average drawdown of 17.5% for the S&P 500 during election years, necessitating cautious investor strategies in light of potential market uncertainties.
CME Group Reports Q2 Average Daily Volume of 29.8M Contracts
- Volume Performance: CME Group's average daily volume for Q2 reached 29.8 million contracts, a 1% year-over-year decline, yet remains the second highest in the history of the derivatives market, indicating sustained market activity.
- Interest Rate Contract Dynamics: The average daily volume for interest rate contracts was 14.5 million, down 6% year-over-year, reflecting a cautious market sentiment regarding interest rate fluctuations, which may impact future rate policy expectations.
- Equity Index Growth: Equity index contracts saw an average daily volume of 8.6 million, up 13% year-over-year, suggesting increased investor confidence in the stock market, potentially driving demand for related financial products.
- Energy and Agricultural Contract Volatility: Energy contracts averaged 2.7 million contracts daily, down 13% year-over-year, while agricultural contracts averaged 2.1 million, up 6%, highlighting varying market volatility and diverse investor strategies.
Gold Price Fluctuations and Investment Outlook
- Gold Price Review: Gold prices surged by 64% last year as investors flocked to safe-haven assets amid rising economic and political uncertainties; however, the price has since dropped by 27% from its all-time high, currently trading below $4,000 per ounce, indicating a shift in market sentiment.
- Inflation and Interest Rate Impact: The U.S. budget deficit reached $1.8 trillion in fiscal 2025, with another trillion-dollar deficit projected for fiscal 2026, pushing national debt towards $40 trillion, which has weakened demand for gold as investors react to the Federal Reserve's hawkish stance, reflecting uncertainty in future economic policies.
- Investment Strategy Adjustment: While gold is considered a good long-term investment, experts recommend that investors limit their gold allocation to 5% to 15% of total assets to ensure some protection during periods of high demand for safe-haven assets.
- ETF Investment Convenience: Many investors opt for exchange-traded funds (ETFs) like SPDR Gold Trust for gold investment, which offers convenience and low annual fees of just 0.4%, allowing investors to adjust their portfolios more flexibly amid gold market fluctuations.
U.S. Economy Adds 57,000 Jobs in June, Unemployment Rate at 4.2%
- Job Growth Slowdown: The U.S. added 57,000 nonfarm jobs in June, significantly lower than the revised 129,000 in May and below the 115,000 forecast, indicating a cooling economy that could dampen consumer confidence and spending.
- Unemployment Rate Shift: While the unemployment rate fell to 4.2%, the labor force participation rate dropped by 0.3 percentage points to 61.5%, the lowest since March 2021, reflecting underlying weaknesses in the labor market that may prompt policymakers to reassess economic outlooks.
- Stable Wage Growth: Average hourly earnings rose by 0.3% for the month and 3.5% year-over-year, aligning with consensus forecasts, suggesting that despite slower job growth, wage levels remain stable, which could support household consumption.
- Mixed Industry Performance: Professional and business services added 36,000 jobs, while leisure and hospitality lost 61,000, highlighting significant disparities across sectors that may affect the overall balance of economic recovery.
Gold Price Fluctuations and Investment Strategies
- Gold Price Volatility: Gold reached a record high of $5,418 per ounce in January 2023 but has since dropped by 27%, trading below $4,000, indicating shifts in market demand and investor sentiment.
- Inflation and Interest Rate Impact: The U.S. budget deficit for fiscal 2025 hit $1.8 trillion, with projections for another trillion-dollar deficit in 2026, pushing national debt towards $40 trillion; this has increased demand for gold as a safe haven, although expectations of Fed rate hikes have shifted market sentiment.
- Investment Return Comparison: Over the past 50 years, gold has averaged a return of 7.2% per year, while the S&P 500 has returned 11.9%, highlighting the advantages of stocks for long-term investment, even as gold retains its value during uncertain times.
- Portfolio Recommendations: Experts suggest allocating 5% to 15% of total assets to gold to ensure some exposure during high demand for safe-haven assets, while considering the storage and insurance costs of physical gold, making SPDR Gold Shares ETF a more convenient investment option.





