Loading...

Intellectia LogoIntellectia
AI Trading Bot
Features
Markets
News
Resources
Pricing
Get Started
  1. Home
  2. Stock
  3. SONY
SONY logo

SONY Overview

-
$
0.000
0.000(0.000%)
At close
0.000(0.000%)Aft-market
ET
$
0.000
0.000(0.000%)
At close
0.000(0.000%)Aft-market
ET
OverviewStock Price PredictionTechnicalValuationFinancialsEarningsShould I BuyNews & Events
an image of Intellectia Logoan image of Intellectia

Most Trusted AI Platform for Winning Trades

TwitterYoutubeQuoraDiscordLinkedinTelegram

Copyright © 2026 Intellectia.AI. All Rights Reserved.

Company

  • Home
  • Contact
  • About Us
  • Press
  • Privacy
  • Terms of Service
  • Service Terms of Use

Resources

  • Blog
  • Tutorial
  • Help Center
  • Affiliate Program

Markets

  • Market Analysis
  • Crypto
  • Featured Screeners
  • AI Earnings Calendar
  • Market Movers
  • Stock Monitor
  • Economic Calendar
  • All US Stocks
  • All Cryptos

Tools

  • Dividend Calculator
  • Dividend Yield Calculator
  • Options Profit Calculator

Features

  • QuantAI Alpha Pick
  • SwingMax Portfolio
  • Swing Trading
  • AI Stock Picker
  • Whales Auto Tracker
  • Daytrading Center
  • Patterns Detection
  • AI Screener
  • Financial AI Agent
  • Backtesting Playground
  • AI Earnings Prediction
  • Stock Monitor
  • Technical Analysis

News

  • Overview
  • Top News
  • Daily Market Brief
  • Earnings Analysis
  • Newswire
  • Stock News
  • Crypto News
  • Institution News
  • Congress News
  • Monitor News

Compare

  • TradingView
  • SeekingAlpha
Intellectia

Loading chart...

High
21.190
Open
21.100
VWAP
21.10
Vol
5.02M
Mkt Cap
124.63B
Low
20.940
Amount
105.82M
EV/EBITDA(TTM)
7.52
Total Shares
5.89B
EV
20.24T
EV/OCF(TTM)
10.29
P/S(TTM)
1.64
Sony Group Corp is a Japan-based company engaged in the games & network services (G&NS), music, movies, entertainment technology & services (ET&S), imaging & sensing solutions (I&SS) and other businesses. It has seven business segments. G&NS segment is involved in network service business, the manufacture and sale of home video game consoles and software. The Music segment mainly includes music production, music publishing and video media platform businesses. The Movies segment mainly includes film production, television program production and media network businesses. The ET&S field mainly includes the television business, audio, video business, still image, video camera business, smartphone business and Internet-related service business. The I&SS segment mainly includes the image sensor business. The Financial segment is involved in the insurance business and banking business. The Other segment consists of activities such as disc manufacturing business and recording media business.
Show More

Events Timeline

(ET)
2026-07-01
12:00:00
Sony PlayStation 6 to be Digital-Only, Expected Launch in 2028
select
link
2026-07-01
08:30:00
Sony to Discontinue Physical Game Disc Production Starting 2028
select
link
2026-07-01
07:00:00
Brightstar Lottery Signs Exclusive Agreement with Sony Pictures
select
2026-06-30 (ET)
2026-06-30
13:00:00
Supreme Court Agrees to Hear Apple's Appeal Against Epic Games
select
link
2026-06-26 (ET)
2026-06-26
14:00:00
Circana: U.S. Video Game Spending Reaches $4.2B in May 2026
select
link
2026-06-25 (ET)
2026-06-25
12:00:00
Sony's Bungie Announces Workforce Reduction
select
link
2026-06-25
12:00:00
Sony Interactive Entertainment Cuts Bungie Workforce
select

News

Fool
7.5
07-02Fool
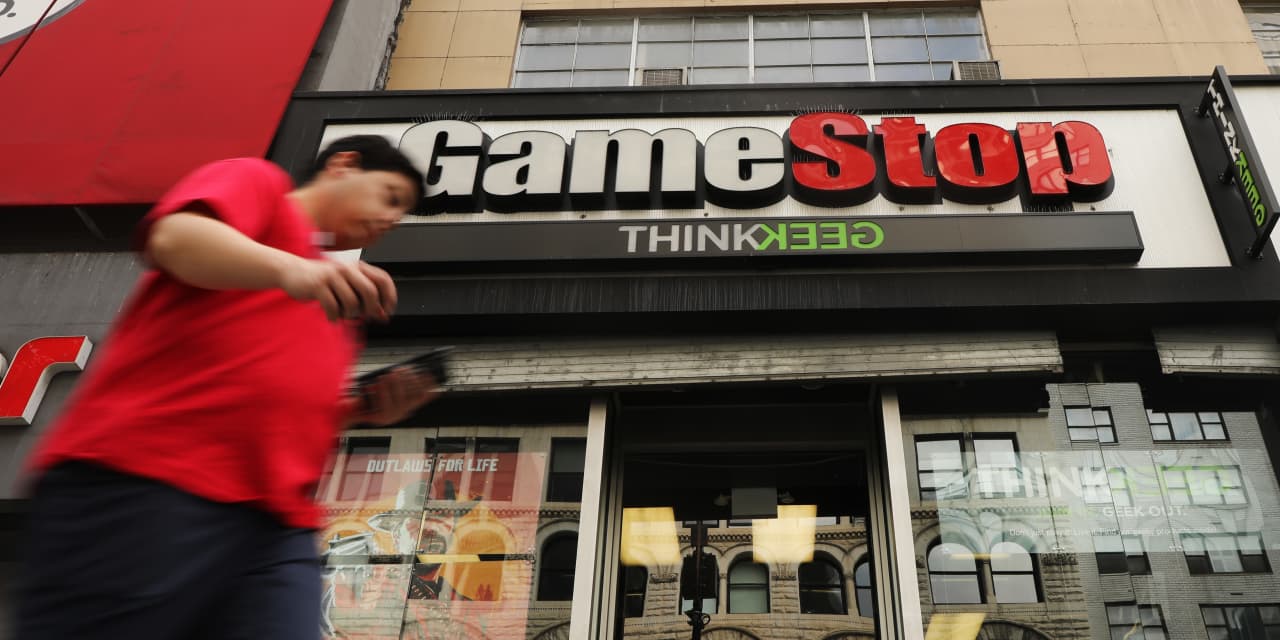
GameStop Faces Challenges Amid Digital Shift
  • Revenue Decline: GameStop's annual revenue has plummeted 61% compared to its peak 14 years ago, with sales contracting for four consecutive fiscal years, indicating severe challenges in a competitive market that necessitates a reevaluation of its business model.
  • Digital Transition Pressure: Sony's announcement to cease physical game disc production starting in 2028 accelerates the industry's shift to digital distribution, posing a risk of declining foot traffic for GameStop, which heavily relies on sales of used discs for profitability.
  • Improved Profitability: Despite declining sales, GameStop's profitability is on the rise, with a surprising 14% increase in net sales driven entirely by heightened interest in trading cards, apparel, and pop culture merchandise; however, excluding collectibles, net sales actually fell by 7%, raising concerns about the sustainability of its business model.
  • Strong Cash Position: GameStop maintains a cash-rich balance sheet, which, while insufficient for acquiring eBay, provides potential for future acquisitions, although any forthcoming deals may need to target smaller companies given the decline in its stock price over the past year.
NASDAQ.COM
8.5
07-02NASDAQ.COM
Sony to Cease Physical Game Disc Production by 2028
  • Decline of Physical Games: Sony's announcement to stop producing physical game discs for new PlayStation releases by 2028 accelerates the industry's shift to digital, likely leading to further declines in GameStop's store traffic and undermining its previously profitable used game market.
  • Revenue Contraction: GameStop's annual revenue has plummeted 61% from its peak 14 years ago, and while sales in collectibles have surged, overall net sales still fell by 7% due to the decline in its used game business, indicating challenges to its business model sustainability.
  • Strong Cash Position: Despite a 4% drop in stock price over the past year and a staggering 56% decline over five years, GameStop's cash-rich balance sheet provides potential for future acquisitions, although it may need to pursue smaller deals to adapt to the current market landscape.
  • Increased Market Competition: With Sony's move, other console makers may follow suit, intensifying competitive pressures on GameStop; although profitability has improved amidst declining sales, the future market outlook remains uncertain.
Fool
2.0
07-02Fool
Semiconductor Industry Fuels AI Growth
  • Industry Growth Forecast: According to Gartner, the semiconductor industry's revenue is expected to surge by 64% to $1.32 trillion in 2026, and exceed $1.55 trillion in 2027, which will significantly enhance the profitability of related companies.
  • TSMC Market Share Increase: TSMC's foundry market share rose from 68% to 73% in Q1 2023, driven by strong demand for its advanced 5nm, 3nm, and 2nm process nodes, with revenue expected to grow at over 20% going forward.
  • ASML Equipment Demand Surge: ASML raised its 2026 revenue guidance to €36 billion to €40 billion, reflecting robust demand for its extreme ultraviolet (EUV) machines, with a forecasted 25% increase in low-NA EUV shipments this year, followed by a 33% jump in 2027.
  • Investor Confidence Boost: With strong performances from TSMC and ASML, analysts are optimistic about both companies' future growth potential, as TSMC's stock has soared 111% over the past year and ASML's by 148%, indicating strong market confidence in the semiconductor sector.
CNBC
8.5
07-01CNBC
PlayStation to End Physical Disc Production for New Games
  • Digital Transformation: Sony announced that starting January 2028, all new games will no longer be produced on physical discs but will be sold digitally through the PlayStation Store or retailers, reflecting a significant shift in consumer preference towards digital media, which is expected to enhance user purchasing convenience and game accessibility.
  • Market Trend Adaptation: This decision is viewed as a 'natural direction' to align with the rapidly growing demand for digital games, which significantly outpaces physical discs, as Sony aims to better connect with user gaming habits, thereby strengthening its competitive position in the market.
  • Impact on Existing Games: Sony clarified that this transition will not affect disc games released before 2028, ensuring that current users' gaming experiences remain intact while paving the way for future digital strategies that may attract more new users.
  • Community Feedback Emphasis: The company noted that this transition will enable it to align more closely with how most community members prefer to access and play games, indicating Sony's commitment to valuing user feedback and enhancing customer satisfaction and loyalty.
Newsfilter
8.5
07-01Newsfilter
PlayStation to End Physical Disc Production for New Games
  • Digital Transformation: PlayStation announced it will cease physical disc production for all new games starting January 2028, shifting to digital sales through the PlayStation Store and retailers, indicating a strong alignment with consumer preferences for digital gaming.
  • Market Adaptation: This decision is viewed as a 'natural direction' for the company to adapt to changing market dynamics, as consumer demand for digital games significantly outpaces that for physical discs, likely driving further growth in digital content sales.
  • Enhanced User Experience: Through this transition, PlayStation aims to align more closely with how most users prefer to access and play games today, enhancing user satisfaction and brand loyalty, which is crucial for maintaining a competitive edge in a rapidly evolving market.
  • Existing Games Unaffected: The company clarified that this transition will not impact disc games released before 2028, ensuring that current users' gaming experiences remain intact while paving the way for future digital strategies.
seekingalpha
8.5
07-01seekingalpha
Sony to Discontinue Physical Game Discs by 2028
  • Digital Transformation: Sony announced that starting January 2028, all new PlayStation games will be released exclusively in digital format, reflecting a shift in consumer preferences towards digital media, thereby allowing the company to better align with how users access and play games.
  • Historical Shift: This decision marks the end of over three decades of physical disc game releases since the original PlayStation launched in 1994, signifying a major transformation in the company's game distribution model.
  • Market Adaptation: Sony stated that this transition will not affect games released before January 2028, ensuring that existing users' gaming experiences remain intact while continuing to offer purchasing options through both PlayStation Store and retail partners.
  • Strategic Focus: By discontinuing physical disc production, Sony will be able to concentrate more on expanding digital distribution, enhancing its competitiveness in the rapidly evolving entertainment industry.
Wall Street analysts forecast SONY stock price to rise
1 Analyst Rating
Wall Street analysts forecast SONY stock price to rise
1 Buy
0 Hold
0 Sell
Moderate Buy
Current: 0.000
sliders
Low
34.00
Averages
34.00
High
34.00
Current: 0.000
sliders
Low
34.00
Averages
34.00
High
34.00
Benchmark
Mike Hickey
Buy
downgrade
AI Analysis
2026-05-11
Reason
Benchmark
Mike Hickey
Price Target
AI Analysis
2026-05-11
downgrade
Buy
Reason
Benchmark analyst Mike Hickey lowered the firm's price target on Sony to 3,900 yen from 4,250 yen and keeps a Buy rating on the shares after a "mixed" quarter. Key catalysts include a "robust" content pipeline across both first- and third-party titles, including Marvel's Wolverine, SAROS, and the expected release of Grand Theft Auto VI, which the firm thinks should drive engagement, monetization, and potentially incremental hardware demand.
BofA
Buy
maintain
$34
2026-05-10
Reason
BofA
Price Target
$34
2026-05-10
maintain
Buy
Reason
BofA raised the firm's price target on Sony to $34 from $30.67 and keeps a Buy rating on the shares. The company posted positive earnings with solid core businesses, the analyst tells investors in a research note.
Unlock Full Analyst Thesis, Get the complete breakdown of rating reason for SONY
Unlock Now

Valuation Metrics

The current forward P/E ratio for Sony Group Corp (SONY.N) is 16.16, compared to its 5-year average forward P/E of 16.32. For a more detailed relative valuation and DCF analysis to assess Sony Group Corp's fair value, Click here.

Forward PE

The forward P/E ratio is a valuation metric that divides a company's current stock price by its estimated future earnings per share over the next 12 months.
StronglyUndervaluedUndervaluedFairOvervaluedStronglyOvervalueddotted line Image
5Y Average PE
16.32
Current PE
16.16
Overvalued PE
21.92
Undervalued PE
10.73

Forward EV/EBITDA

The forward EV/EBITDA ratio is a valuation metric that divides a company's enterprise value (EV) by its estimated future earnings before interest, taxes, depreciation, and amortization (EBITDA) over the next 12 months.
StronglyUndervaluedUndervaluedFairOvervaluedStronglyOvervalueddotted line Image
N/A
5Y Average EV/EBITDA
8.56
Current EV/EBITDA
-0.16
Overvalued EV/EBITDA
11.72
Undervalued EV/EBITDA
5.39

Forward PS

The forward P/S ratio is a valuation metric that divides a company's current stock price by its estimated future sales (or revenue) per share over the next 12 months.
StronglyUndervaluedUndervaluedFairOvervaluedStronglyOvervalueddotted line Image
5Y Average PS
1.29
Current PS
0.01
Overvalued PS
1.80
Undervalued PS
0.78

Financials

AI Analysis
Annual
Quarterly

Related Community Screener

Stock Bullish trends
Intellectia · 6 candidates
Themes: Online Gaming, Movie and Entertainment, Casino and Online GamblingPrice Change Pct: >= $0.00Moving Average Relationship: PriceAboveMA5, PriceAboveMA20, PriceCrossAboveMA5, PriceCrossAboveMA20Is Optionable: True
Ticker
Name
Market Cap$
top bottom
SE logo
SE
Sea Ltd
51.98B
SONY logo
SONY
Sony Group Corp
125.77B
NFLX logo
NFLX
Netflix Inc
359.81B
DIS logo
DIS
Walt Disney Co
181.85B
NVDA logo
NVDA
NVIDIA Corp
5.33T
DKNG logo
DKNG
Draftkings Inc
21.79B
top value stocks
Intellectia · 85 candidates
Market Cap Category: large, midCurrent Ratio: >= 1.00Pe Ttm: <= 15Ps Ratio: <= 3.00P/B Ratio: <= 3.00Return On Equity: >= 0.0%P Fcf Ratio: <= 15.00Free Cash Flow Ttm: >= 0
Ticker
Name
Market Cap$
top bottom
BILL logo
BILL
BILL Holdings Inc
4.14B
CALY logo
CALY
Callaway Golf Co
3.19B
AXIA logo
AXIA
Axia Energia SA
26.97B
EC logo
EC
Ecopetrol SA
25.99B
KT logo
KT
KT Corp
10.20B
TGS logo
TGS
Transportadora de Gas del Sur SA
4.42B
What are the best stocks to buy right now?
Intellectia · 18 candidates
Region: USQuarter Revenue Yoy Growth: >= 0.0%Market Cap Category: large, megaAnalyst Consensus: Strong Buy, Moderate BuyQuarter Eps Yoy Growth: >= 0.0%Gross Margin: >= 30.00Net Margin: >= 10.00Relative Vol: >= 1.50Revenue 5yr Cagr: >= 0Eps 5yr Cagr: >= 0List Exchange: XNYS, XNAS, XASETarget Price Upside Potential: AbovePrice, MoreAbovePriceMoving Average Relationship: PriceAboveMA20, PriceAboveMA200, PriceCrossAboveMA20, PriceCrossAboveMA200
Ticker
Name
Market Cap$
top bottom
RGLD logo
RGLD
Royal Gold Inc
20.10B
AGI logo
AGI
Alamos Gold Inc
17.64B
B logo
B
Barrick Mining Corp
69.66B
NBIX logo
NBIX
Neurocrine Biosciences Inc
14.78B
ANET logo
ANET
Arista Networks Inc
214.34B
GEN logo
GEN
Gen Digital Inc
11.85B
top investment for cheap buy
Intellectia · 208 candidates
Market Cap: >= 300.00MPrice: <= $20.00Analyst Consensus: Moderate Buy, Strong BuyEps Ttm: >= 0Free Cash Flow Ttm: >= 0
Ticker
Name
Market Cap$
top bottom
SONY logo
SONY
Sony Group Corp
116.85B
ITUB logo
ITUB
Itau Unibanco Holding SA
95.00B
NOK logo
NOK
Nokia Oyj
74.38B
ET logo
ET
Energy Transfer LP
68.60B
TAK logo
TAK
Takeda Pharmaceutical Co Ltd
52.51B
HBAN logo
HBAN
Huntington Bancshares Inc
33.71B
what sector is undervalued right now
Intellectia · 90 candidates
Market Cap Category: small, mid, large, megaRelative Vol: >= 1.50Pe Ttm: <= 15Ps Ratio: <= 3.00P/B Ratio: <= 3.00Ev Ebitda: <= 12
Ticker
Name
Market Cap$
top bottom
SHEL logo
SHEL
Shell PLC
248.20B
SONY logo
SONY
Sony Group Corp
116.85B
CI logo
CI
Cigna Group
77.07B
NTES logo
NTES
NetEase Inc
72.42B
VALE logo
VALE
Vale SA
67.67B
ACGL logo
ACGL
Arch Capital Group Ltd
32.72B
preis &gt; 10 und &lt; 50
Intellectia · 1706 candidates
Price: $10.00 - $50.00
Ticker
Name
Market Cap$
top bottom
BAC logo
BAC
Bank of America Corp
352.86B
VZ logo
VZ
Verizon Communications Inc
208.35B
T logo
T
AT&T Inc
197.80B
MUFG logo
MUFG
Mitsubishi UFJ Financial Group Inc
197.31B
NVO logo
NVO
Novo Nordisk A/S
165.12B
SAN logo
SAN
Banco Santander SA
164.81B
and under 200 moving avarage
Intellectia · 567 candidates
Sector: Financial Technology (Fintech) & Infrastructure, Technology, Technology EquipmentList Exchange: XNYS, XNAS, XASEMoving Average Relationship: PriceBelowMA200
Ticker
Name
Market Cap$
top bottom
MSFT logo
MSFT
Microsoft Corp
2.96T
META logo
META
Meta Platforms Inc
1.65T
AVGO logo
AVGO
Broadcom Inc
1.51T
MA logo
MA
Mastercard Inc
464.63B
ORCL logo
ORCL
Oracle Corp
428.81B
NFLX logo
NFLX
Netflix Inc
409.93B
tech stocks under 200 moving avarage
Intellectia · 567 candidates
Sector: Financial Technology (Fintech) & Infrastructure, Technology, Technology EquipmentList Exchange: XNYS, XNAS, XASEMoving Average Relationship: PriceBelowMA200
Ticker
Name
Market Cap$
top bottom
MSFT logo
MSFT
Microsoft Corp
2.96T
META logo
META
Meta Platforms Inc
1.65T
AVGO logo
AVGO
Broadcom Inc
1.51T
MA logo
MA
Mastercard Inc
464.63B
ORCL logo
ORCL
Oracle Corp
428.81B
NFLX logo
NFLX
Netflix Inc
409.93B
What the best trade I can take now
Intellectia · 85 candidates
Region: USPrice: $15.00 - $120.00List Exchange: XNYS, XNAS, XASEMoving Average Relationship: PriceAboveMA20One Week Rise Prob: >= 75Monthly Average Dollar Volume: >= 2,000,000
Ticker
Name
Market Cap$
top bottom
SON logo
SON
Sonoco Products Co
5.57B
WBS logo
WBS
Webster Financial Corp
11.63B
CMCL logo
CMCL
Caledonia Mining Corporation PLC
612.73M
AVTX logo
AVTX
Avalo Therapeutics Inc
323.97M
CAKE logo
CAKE
Cheesecake Factory Inc
3.23B
ALNT logo
ALNT
Allient Inc
1.12B
tech stocks under 200 ma for 100 days
Intellectia · 547 candidates
Sector: Financial Technology (Fintech) & Infrastructure, Software & IT Services, Technology, Technology EquipmentList Exchange: XNAS, XNYS, XASEMoving Average Relationship: PriceBelowMA200
Ticker
Name
Market Cap$
top bottom
MSFT logo
MSFT
Microsoft Corp
3.07T
META logo
META
Meta Platforms Inc
1.70T
MA logo
MA
Mastercard Inc
482.26B
ORCL logo
ORCL
Oracle Corp
459.38B
NFLX logo
NFLX
Netflix Inc
347.10B
PLTR logo
PLTR
Palantir Technologies Inc
332.51B

Whales Holding SONY

Trading Trends

    Insider
    Hedge Fund
    Congress Trading

People Also Watch

Frequently Asked Questions

What is Sony Group Corp (SONY) stock price today?

The current price of SONY is 21.16 USD — it has increased 1.78

What is Sony Group Corp (SONY)'s business?

Sony Group Corp is a Japan-based company engaged in the games & network services (G&NS), music, movies, entertainment technology & services (ET&S), imaging & sensing solutions (I&SS) and other businesses. It has seven business segments. G&NS segment is involved in network service business, the manufacture and sale of home video game consoles and software. The Music segment mainly includes music production, music publishing and video media platform businesses. The Movies segment mainly includes film production, television program production and media network businesses. The ET&S field mainly includes the television business, audio, video business, still image, video camera business, smartphone business and Internet-related service business. The I&SS segment mainly includes the image sensor business. The Financial segment is involved in the insurance business and banking business. The Other segment consists of activities such as disc manufacturing business and recording media business.

What is the price predicton of SONY Stock?

Wall Street analysts forecast SONY stock price to rise over the next 12 months. According to Wall Street analysts, the average 1-year price target for SONY is34.00 USD with a low forecast of 34.00 USD and a high forecast of 34.00 USD. However, analyst price targets are subjective and often lag stock prices, so investors should focus on the objective reasons behind analyst rating changes, which better reflect the company's fundamentals.


What is Sony Group Corp (SONY)'s revenue for the last quarter?

Sony Group Corp revenue for the last quarter amounts to 19.35B USD, increased 12.32

What is Sony Group Corp (SONY)'s earnings per share (EPS) for the last quarter?

Sony Group Corp. EPS for the last quarter amounts to 0.09 USD, decreased -57.14

How many employees does Sony Group Corp (SONY). have?

Sony Group Corp (SONY) has 112300 emplpoyees as of July 07 2026.

What is Sony Group Corp (SONY) market cap?

Today SONY has the market capitalization of 124.63B USD.